Xbase++ Workbench:xwb
Debug Windows Foundation
Variables
View-> Debug Windows-> Variables (Shift+Alt+1)
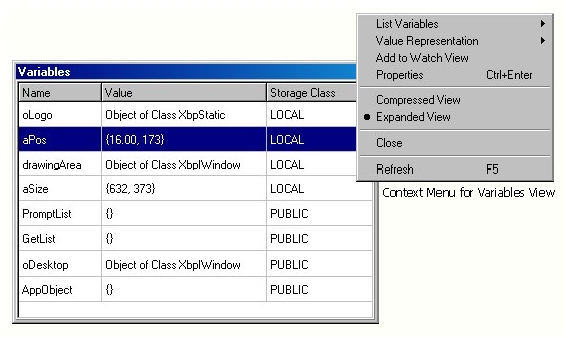
Expanded Variables View
The Variables view displays debug information for all variables that are currently visible in the debugged application. Variables can be included or excluded from the list by scope. The default is set in the Tools-> Debugger Options-> Variables Tab. The scope can be changed via the context menu item List Variables.
Breakpoints
View-> Debug Windows-> Breakpoints (Shift+Alt+2)
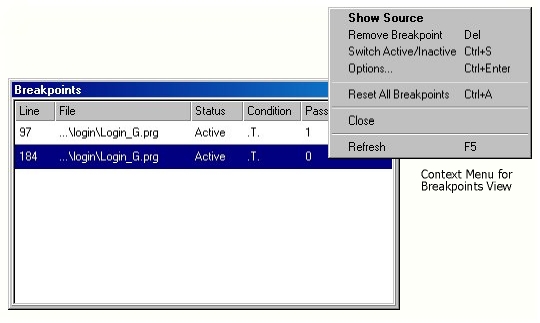
The Breakpoints view displays all breakpoints set in the in the application when the debugger is active. Breakpoint information includes line number and source code file, the activation status and condition of a breakpoint and how often the line in the source code is already executed where the breakpoint is defined.
Context Menu Options
Show Source
Loads the source code file into the Editor and positions the cursor in the line where the breakpoint is set.
Remove Breakpoint
Deletes this breakpoint.
Switch Active/Inactive
Toggles the activation status of a breakpoint. When a breakpoint is inactive, it remains defined but is no longer monitored by the debugger.
Options...
Opens the Breakpoint Options window where the condition for a breakpoint can be defined, how often a breakpoint should be monitored by the debugger or where to log breakpoint information.
Reset All Breakpoints
Removes all breakpoints.
Close
Closes the Breakpoint view. The view is also closed with the Esc key.
Refresh
Updates the Breakpoints view with the current context of the application.
Callstack
View-> Debug Windows-> Callstack (Shift+Alt+3)
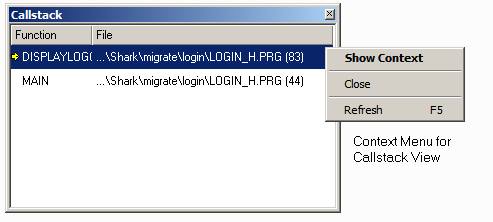
The Callstack view displays all functions, procedures and methods that are currently invoked in the debugged application. Select Show Contextfrom the context menu to see from where in the source code a function, procedure or method is currently called.
Threads
View-> Debug Windows-> Threads (Shift+Alt+4)
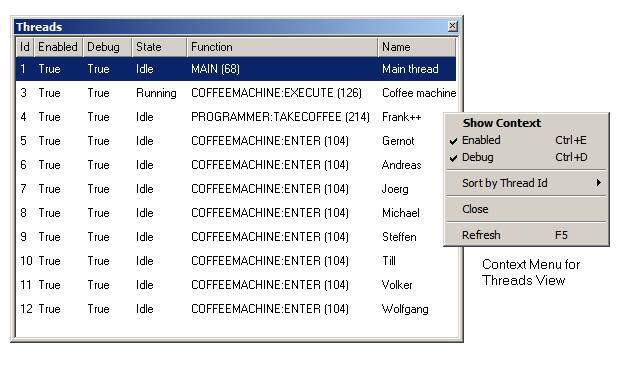
The Threads view displays debug information for all threads created in an application. Options in the context menu allow for disabling/enabling thread execution (Enabled option) and whether or not the debugger should monitor a particular thread (Debug option).
Watch View
View-> Debug Windows-> Watch View (Shift+Alt+5)
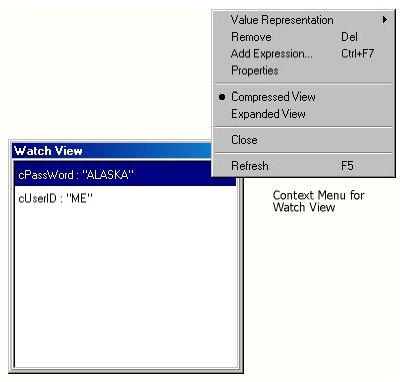
The Watch View window displays values of variables and results of expressions during a debug session. Variables are added to the Watch view via the context menu of the Variables window, while expressions are added via the Expression Inspector . The shortcut for the Expression Inspector is Ctrl+F7. It can also be opened via the context menu of the Source Code Window or the Variables window.
Module View
View-> Debug Windows-> Module View (Shift+Alt+6)
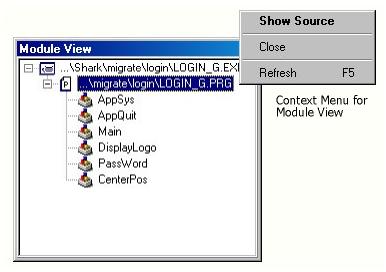
The Module View displays debug information for source code elements available at runtime. The information may be the same as displayed by the Project Manager or Code Explorer and may appear redundant. However, when a DLL including debug information is loaded at runtime with the DllLoad() function, the Module View displays debug information of the dynamically loaded DLL. This way, breakpoints can be set in the source code of a DLL that is not part of the current target.
Feedback
If you see anything in the documentation that is not correct, does not match your experience with the particular feature or requires further clarification, please use this form to report a documentation issue.