Xbase++ Workbench:xwb
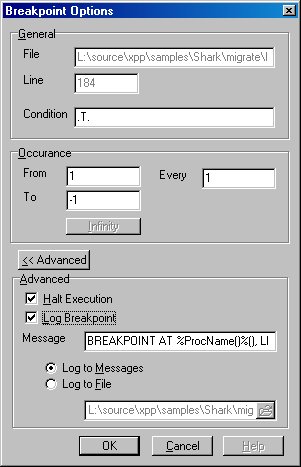
Breakpoint Options Foundation
A breakpoint is set with the shortcut F5 or by double clicking a line number in the gutter of the Source Code Window. Breakpoints define lines in the source code where the debugger should halt program execution or collect debug information.
Breakpoint options instruct the debugger what to do when it executes a line of the source code where a breakpoint is set. The Breakpoint Options window is opened via the context menu of the Breakpoints window (View-> Debug Windows-> Breakpoints).
All options available in this window can be set individually for all breakpoints defined during a debug session.
File
Informational: the file where a breakpoint is set.
Line
Informational: the line number where a breakpoint is set.
Condition
A logical expression can be entered that must result True (.T.) in the context of the breakpoint. The debugger ignores the breakpoint if the condition results False (.F.). The default condition is the value True (.T.). Any other logical expression turns a breakpoint into a Trace point.
For example, the debugger may interrupt the program when the condition Trim(CUSTOMER->LASTNAME) == "Miller" is true. That means, the debugger can interrupt program execution when an individual variable or the result of an expression has a particular value.
From
Defines the start point from where on the debugger should monitor the breakpoint. When 10 is entered, for example, the line in the source code must be executed 10 times before the debugger starts monitoring the breakpoint.
To
Defines the end point from where on the debugger ignores the breakpoint. When 100 is entered, for example, the defined breakpoint is ignored after the line in the source code is executed 100 times. The default is -1 which means that the breakpoint is monitored each time the corresponding line in the source code is executed (monitor breakpoint until infinity).
Every
Defines how many times a breakpoint must be executed until it is monitored again by the debugger
Halt Execution
ON: The debugger interrupts program execution when a breakpoint is reached.
OFF: The debugger does not interrupt program execution when a breakpoint is passed.
Log Breakpoint
ON: The debugger logs messages when a breakpoint is passed during program execution.
OFF: The debugger does not log messages during program execution.
Message
This entry field defines the message that is created by the debugger when a breakpoint is passed. The message consists of textual information and/or expression information. Expression information is the result of an expression evaluated in the debugged program. The expression is evaluated in the context of the breakpoint.
When the debugger message should include the result of an expression taken from the debugged program, the expression must be embedded in % signs. For example:
BREAKPOINT AT: %ProcName()% LINE: %ProcLine()%
This debugger message consists of the textual information BREAKPOINT AT:and LINE:. The expression information for the debugger message is taken from the function calls ProcName() and ProcLine(), both are embedded in % characters.
When the % character must appear as textual information, two %% signs must be entered into the entry field.
Log to Messages
The breakpoint message is displayed in the Messages window.
Log to File
The breakpoint message is added to the defined log-file.
Feedback
If you see anything in the documentation that is not correct, does not match your experience with the particular feature or requires further clarification, please use this form to report a documentation issue.