Xbase++ Workbench:xwb
Debugger overview Foundation
The Xbase++ Workbench Debugger uses a variety of dockable windows for presenting debug information at runtime of an application. The debugger is active when an application is invoked via the Run Menu.
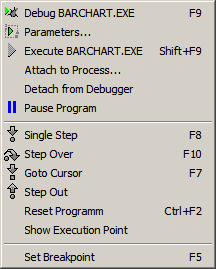
Run Menu
The name of the active target is displayed in the Run menu (LOGIN_G.EXE). The debugger invokes this target when one of the shortcut keys for debugging is pressed. Note that the active target is defined by the Project Manager when a project consists of multiple targets.
Debug <Target>
Executes the target and halts program execution at the first breakpoint.
Parameters
Opens the Parameters window for the definition of command line parameters to pass to the application.
Execute <Target>
Executes the program without interrupting it at defined breakpoints.
Attach to Process...
Opens a window for selecting a running process. This allows to attach the debugger to a program which is already running.
Detach from Debugger
Detaches the program from the debugger. This menu item is selectable only if a program is currently running in the debugger.
Pause Program
Halts a running program and re-activates the debugger. This option is only enabled when the debugger turned control to the debuggee.
Single Step
Executes a single line in the source code.
Step Over
Executes a function, method or procedure call without debugging the called routine.
Goto Cursor
Executes the program and interrupts it in the line where the cursor is located.
Step Out
Completes a function, method or procedure call and halts the program in the calling routine.
Reset Program
Terminates the debugged program.
Show Execution Point
Displays the line in the source code that is currently executed in the Source Code Window.
Set Breakpoint
Sets a breakpoint in the source code where the debugger should halt program execution.
As soon as the debugger has control over the debugged program, debug information becomes available in the windows opened via the View menu and its View-> Debug Windowssubmenu. Windows relevant for the debugger are:
Object Inspector ; HD2_OBJECT_INSPECTOR__
Displays the contents of complex data types like Objects amd Arrays.
Variables window ; HD3_VARIABLES__
Displays variables currently visible in an application by scope.
Breakpoints window ; HD3_BREAKPOINTS__
Displays all breakpoints currently set.
Callstack window ; HD3_CALLSTACK__
Displays functions, methods and procedures currently being executed.
Threads window ; HD3_THREADS__
Displays debug information for threads.
Watch View ; HD3_WATCH_VIEW__
Displays variables and expressions added to the Watch list.
Module View ; HD3_MODULE_VIEW__
Displays debug information for all modules currently loaded by the application.
Expression Inspector ; HD2_EXPRESSION_INSPECTOR__
Displays the result of expressions.
Each window presents a particular type of debug information that may be relevant for identifying a runtime error or checking if an application works as expected.
The very common question What is the value of a variable? can be answered by the debugger without opening an additional debug window. The only thing to do is to point with the mouse to the name of the variable that is of interest:
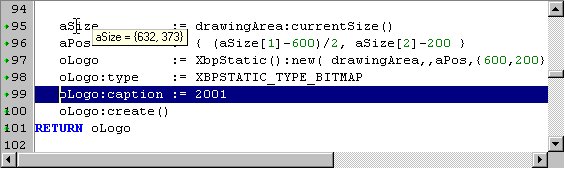
Debugger tool-tip
This screen shot illustrates the following situation: The debugger is about to execute line #99, i.e. the highlighted line is the next line that is executed in Single Step mode (F8). The value of the variable aSize is displayed in a tool-tip since the mouse pointer (caret) is located in line #95.
Another common question What is the result of an expression? can be answered in a similar easy way: just mark the expression in the source code and press Ctrl+F7. This shortcut opens the Expression Inspector which displays the result of the marked expression.
Feedback
If you see anything in the documentation that is not correct, does not match your experience with the particular feature or requires further clarification, please use this form to report a documentation issue.