Xbase++ Workbench:xwb
Debugger Options Foundation
General Tab
Tools-> Debugger Options-> General
General configuration data for the debugger is maintained in this tab.
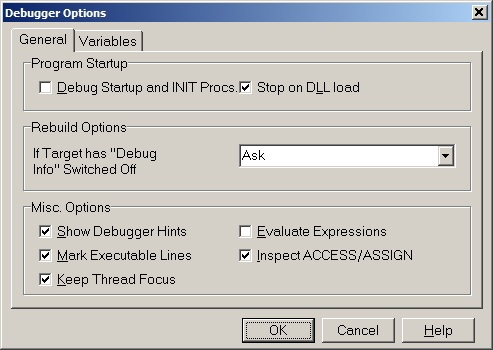
Debug Program Startup
ON: the debugger includes all INIT PROCEDURES at the start of a debugging session.
OFF: the debugger executes all INIT PROCEDURES and starts the debug session with the Main procedure.
Stop on DLL load
ON: the debugger stops program execution at the first executable line of an Xbase++ DLL loaded using DLLLoad().
OFF: program execution stops only if a breakpoint is set in the DLL.
Rebuild Options
This option instructs the debugger how to react when the target has no debug information. The user can be Asked before the target is rebuilt, the debugger can Always Rebuild automatically, or Never Rebuild. In the last case, the debugger never causes the target to be rebuild when no debugging information is compiled into the executable.
If Never Rebuild is selected, items in the Run menu such as Step Intoor Step Over are disabled when no debugging information is available. In this case, the only action that can be performed is Run -> Debug <Target>which loads the executable into the debugger and starts the application. If a module (DLL) is loaded at runtime, the debugger will halt the debuggee at the first line for which debugging information is available in the loaded module. This allows to debug Web Application Adaptor (WAA) packages, for example.
Show Debugger Hints
ON: when variables are pointed to with the mouse, the debugger displays their value in a tooltip.
OFF: the debugger displays no tooltip.
Mark Executable Line
ON: executable lines of the source code are marked with green dots in the editor gutter.
OFF: executable lines are not marked.
Evaluate Expressions
ON: displays the result of an expression that is pointed to with the mouse in a tool-tip. Caution, be extremely careful with the mouse pointer when setting this switch ON. For example, if the expression you point to is oXbp:destroy(), the debugger calls the :destroy()method and displays its return value. This can lead to a situation where the debugged program enters an unstable state.
OFF: does not evaluate expressions that are pointed to with the mouse.
Inspect ACCESS/ASSIGN
ON: the debugger executes the ACCESS methods defined for member variables when inspecting objects. This causes all member variables to be displayed in Object Inspector, including computed ones.
OFF: only 'physical' member variables declared using VAR <VarName> in the class declaration are displayed in Object Inspector.
Keep thread focus
ON: the debugger follows execution of the current thread when stepping through code via the Step Into command. The debugger only switches to the context of another thread if a breakpoint is reached, or if the current thread performs a lengthy operation.
OFF: the debugger switches to the context of whichever thread that happens to execute the next code.
Variables Tab
Tools-> Debugger Options-> Variables
This tab sets the default options for the debug window displaying variables (View-> Debug Windows-> Variables) and how the Object Inspector presents debug information.
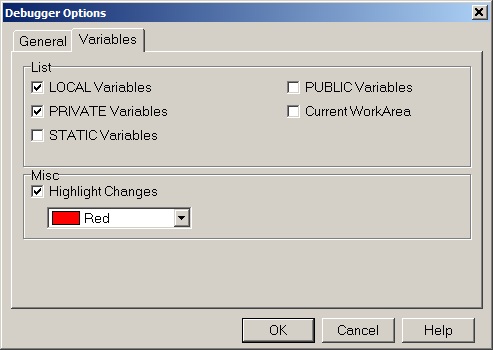
List
These switches identify the variables by scope that are listed in the Variables window by default. The Current Workarea switch includes FIELD variables.
Manipulation
Variables of complex data type, like Array and Object, can be edited either in the Variables window or in the Object Inspector. When in-place editing is choosen for the Variables window, the Object Inspector displays additional debug information.
Misc
The Highlight Changes option instructs the debugger to highlight a variable in the Variables window when its value is changed in the debugged program. The color used for highlighting can be selected.
Feedback
If you see anything in the documentation that is not correct, does not match your experience with the particular feature or requires further clarification, please use this form to report a documentation issue.